The exploitation of easy money
Rock bottom interest rates and easy money are nothing new to corporations. The cost of debt capital is hitting 50 year lows across the board. But who has taken advantage and how aggressively? As I have written previously, corporations could see significant headwinds in the coming years when interest rates start to rise. The challenge for investors will be identifying the winners and losers of rising rates.
The chart below looks at the range of debt cost by sector over the last five decades. Note the wide range for Info Tech and Consumer Discretionary, most commonly viewed as "riskier" from a lender's perspective because there are few hard assets to use as supporting collateral. Utilities and Energy firms on the other hand have enjoyed a relatively tight range of debt costs, likely because their businesses require significant hard assets, which can be pledged as security for creditors. Of note is the current, and most favorable, position of Financials.
Financials have been great beneficiaries of low and perpetually decreasing interest rates. As intermediaries for the economy, Financials lay at the epicenter of great transfers of wealth. If you believe, as Ray Dalio does, that the economy is the sum of millions of transactions that aggregate in an "economic machine", then the growth in the financial sector over the last several decades seems predestined in retrospect. Financials take a fee for nearly every one of those transactions--from credit card swipes to corporate bond issuance to stock offerings to mortgages and ATM fees. As expert participants in the capital markets, Financials also have the ability to arrange for rock bottom financing for themselves.
It is no surprise then that financials have taken advantage of cheap capital for themselves. Over the last five decades, Financials booked the highest inflation-adjusted growth in long term debt of any sector. The growth in debt for the sector has exceeded the growth in their underlying equity market cap by 5.6% per year--translation, financials are much more levered than in the past. As is shown in the chart below, every sector's growth in long term debt exceeds that of the growth in market cap.
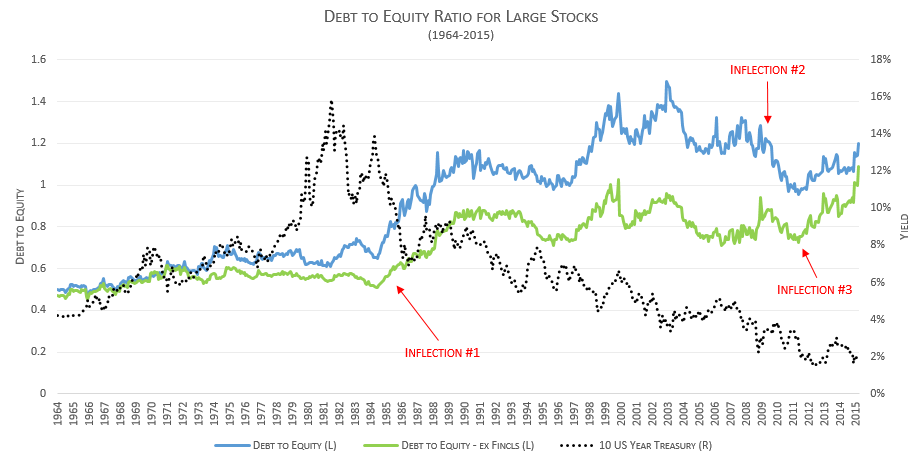
The result is that the average debt to equity ratio has risen from around 0.5 in 1964 to 1.2 today. There are a few critical inflection points over that time frame that are shown in the chart below.
Inflection #1: As yields came down from all-time highs, corporations embarked on a multi-decade trip down the debt super highway. A disparity developed between the leverage of the market as a whole and the market ex Financials.
Inflection #2: The credit crisis required firms to massively rein in leverage to shore up balance sheets. Some of this was forced, i.e. Financials. Some of it was quasi-voluntary. I say quasi because corporations simply had a difficult time rolling over maturing debt.
Inflection #3: By mid-2011, equity markets had recovered substantially enough that investors became more comfortable with risky assets again. It certainly helped that QE forced income seeking investors out on the risk curve. With yields approaching all-time lows, savers were required to move into risky assets to obtain reasonable yields. Corporations took note and have taken every opportunity to issue long term debt capital at exceptionally low rates while investors are interested. The result has been a levering of NON-Financial sectors (green line) well in excess of credit crisis levels.
When do you think the next inflection point will be and what will it look like?


